Accessible Visualizations
Overview
Teaching: 10 min
Exercises: 0 minQuestions
How can we make our visualizations accessible to the widest possible range of viewers?
Objectives
motivate learners to write good captions and alt-text
understand why certain colour combinations should be avoided
advocate for the use of multiple channels of conveying the same information.
Designing Accessible Visualizations
In the introduction, we highlighted that visualizations should be readable and understandable by the widest possible range of viewers. When we write papers, blog posts or other scientific materials, and include figures for them, our viewers will likely include individuals with vision impairments.
Data visualization is, by its very name, an inherently visual medium, but this does not mean we don’t have a responsibility to make the same information accessible to everyone!
When designing visualizations with accessibility in mind, there are (at least) three different cases to be aware of:
- Individuals interacting through a screen reader
- Individuals with low vision
- Colour-blind individuals
For each, there are a number of fairly low-effort steps you can take to improve accessibility. Many of these recommendations come from the Accessibility Guide of the US Consumer Financial Protection Bureau. An informative blog post by Amy Cesal, who led the creation of this guide, can be found on the Storytelling with Data blog.
Accessibility beyond Vision
While vision is one accessibility consideration, it is by no means the only one! A wide range of readers will be helped by making your figures as accessible as possible, and vision should not be your only consideration when designing accessible visualizations.
The UK Home Office has designed a number of excellent posters about accessible design for a wider range of users.
There are many discussions about accessibility in design happening under the hashtag a11y. Regularly inform yourself about best practices, because as technology changes, these best practices might change, too!
Individuals with Low Vision and Screen Readers
For screen readers, providing informative captions and alternative texts (text that is read out by a screen reader instead of displaying the image, e.g. on websites) are key for giving users an overview of what you are displaying. Make sure your figures have a good caption or alt-text!
The CFPB guide linked above suggests to include
- One sentence of what the chart is, including the chart type for users with limited vision who can see part of it, but may not be able to have a full understanding of the graph.
- A link to a CSV or other machine-readable data format with the data so people with impaired vision can tab through the data with a screen reader. The data should have descriptive column labels and provide a link.
For example, in Markdown, the language that this tutorial was written in, you can add alternative text for a figure like so

In HTML,alt tags allow inclusion of alternative tags e.g. for images:
<img src="mybarchart.png" alt="Bar graph of quantity Y for each of the categories A, B and C." />
In Word, right-clicking on a Figure will allow you to attach alternative text. In LaTex, no such straightforward solution exists to my knowledge. One solution is to make your figures as descriptive as possible: make sure you include the type of figure, the information that is plotted, and the main conclusion that the reader should draw from the figure. This will help a wide range of readers make sense of your figures!
For viewers with low vision, high contrast in your figures can be extremely important. Make sure you use high-contrast colours to convey the most important information, your fonts are big enough and your figures follow a clear, logical layout.
You can check your colour palette for accessibility in terms of contrast using this tool.
Colour Blindness
There are three types of colour blindness that lead certain individuals to have problems distinguishing red and green, or blue and yellow. The most common type, affecting the ability to tell apart red and green, affects ~8% of men with European ancestry, and 1% of women.
When designing data visualizations, design with these individuals in mind! In general, it is advisable to avoid encoding information through only one channel (colour), but this is especially true when the encoding involves colours that are difficult to tell apart from some viewers.
As an example, take a look at this figure (you’ll meet those again in the walkthrough at the end of this tutorial):
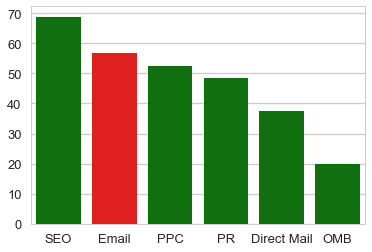
Chances are if you’re not red/green blind, the bar labelled “e-mail” might pop out at you immediately as being special. However, we can use Color Oracle (see below for details) to simulate what this figure might approximately look like to someone with red/green blindness, and find the following:

Does e-mail still pop out at you in the same way? Likely not, because now what was red and green appear to be very nearly the same colour.
In general, avoid these colour combinations. If you cannot for whatever reason, ensure that information is not only conveyed through colour. For example, you can use luminance and intensity to help distinguish the two, along with shape or size. Encoding the same information in multiple channels does not only help viewers with colour blindness, but more generally makes it easier for viewers to understand your figure!
To check how your visualization would look for a user with colour blindness, there are a number of tools out there that can help you. Coblis is a colour blindness simulator that allows you to upload figures. I use Color Oracle, an app that temporarily modifies the colours of your entire computer screen to simulate colour blindness. I find this particularly helpful when generating visual information that cannot be encapsulated in a single figure, like a conference presentation.
Key Points
Accessibility should be a core goal of data visualization.
Some viewers may have difficulty distinguishing certain combinations of colours. These colour combinations should be avoided or supplemented by an additional channel of visualization (e.g. shape) to support understanding.
Visualizations should include descriptive alternative text for screen readers and link to a machine-readable table for the underlying data.