Data Visualization & Society
Overview
Teaching: 10 min
Exercises: 10 minQuestions
How does data visualization impact our lives?
How can data visualization be used to (mis-)inform the public?
Objectives
Provide a connection between data visualization in a scientific and more generally in societal contexts
Dispel notion of data visualization as an objective tool of data representation
Encourage learners to think critically about visualizations they encounter, and what the motivation of their creators might be
Data visualizations don’t happen in a vacuum. By the time a designer creates a visualization for publication, be it on the web, in a newspaper or a scientific publication, a signficant amount of thought has been expended to figure out what kind of message the visualization aims to support. In a scientific publication, it might be a new research result. In a newspaper, it might be an ideological point of view. In neither case is a visualization an absolutely objective representation of the data.
This is similar to how photography is not an objective view of reality. A photographer has made a million choices: they have chosen a particular instant of time to take the photo, and a particular small view of the world around them. They have decided to focus on some part of the field of view rather than another.
In a similar way, when you create a data visualization, you make particular choices: of which data to plot in the first place, how to orient and scale the axes, whether to use a pie chart or a stacked bar chart to show your data, and how to colour the individual elements. All these choices have a conscious or subconscious effect on where the viewer will focus their attention, what they will take away from the visualiztion, and how that fits in with the larger story you are trying to tell.
Because of the many choices one can make while designing a visualization, there is significant potential to build visualizations that misrepresent the data or simply mislead the viewer. This can occur both accidentally or deliberately, and as such, data visualization has an ethical dimension:
Ethical Data Visualization
As creators of visualizations, we should strive to make design choices that help us represent the data and the conclusions the data supports as accurately as possible, and not wilfully mislead viewers.
We have seen a number of examples (and will see a few more) of visualizations that were misleading through bad design. We have also already seen a visualization that was wilfully misleading:
In the episode on visualization types, we talked about this figure, tweeted out by the National Review:
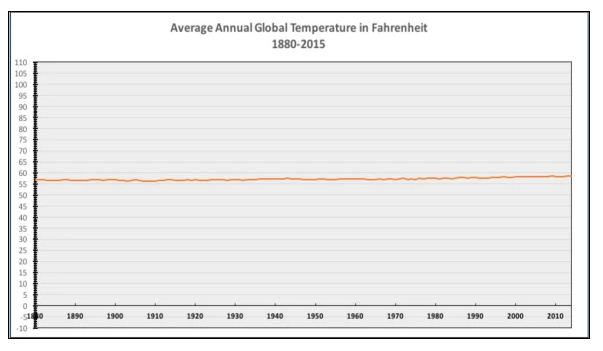
In this previous episode, this served as an example of a case where including the zero-point of the y-axis is not appropriate, because what matters are relative changes in temperature. This is a great example of a plot that is misleading in service of the political agenda of the organization that created and published it, which aims to discredit climate change.
The y-axis scale ranges from 0 to 110 degrees Fahrenheit (-17 to 43 degrees Celsius), which is certainly a much wider range than some places in the world (certainly my current home Seattle) ever expereience. Based on geological temperature records, average temperatures have fluctuated over a range of about 10 degrees Celsius during the past five million years. Using a scale to display this data that ranges over nearly 60 degrees celsius is not a meaningful comparison, and misleading without the necessary context.
Data Visualization for Economic Policy
Let’s look at another example, again from a topic where data drives policy decisions, and is thus hotly debated in political circles (you might notice a trend there): economic policy. Societies in general, and governments in particular, constantly ask themselves and their voters whom to tax, and how much different income groups in society should be taxed. Should the very wealthy pay a higher tax? Should poor citizens pay higher taxes? Should those in the middle, often called the middle class? Which of these groups collectively holds the most money that could be extracted in the form of taxes?
The latter was a question that the Wall Street Journal asked in an opinion piece, using the following visualization of data from the US Internal Revenue Service (IRS), which collects taxes from US citizens:
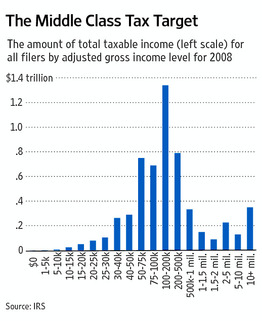 Image Source: Wall Street Journal
This plot shows the amount of total taxable income for people in a certain income range. That is, the US taxpayers who earn between 100,000 and 200,000 US dollars per year had, all taken together, a total income of almost 1.3 trillion dollars that could be taxed. Looking at this figure, you might conclude that if we wanted to generate the most taxes, we should tax people who earn between 50,000 and 500,000 US Dollars, because they tend to have the most total income, when taking all people who earn money in those segments.
However, there is a crucial problem with this plot: the bars on the x-axis don’t represent equally sized bins in income. For example, the second bar contains all people who earned between 1,000 and 5,000 US Dollars ina given year, but the second-to-last bracket contains all people who earned between 5 million and ten million US Dollars per year. Those ranges are vastly different!
Why does this matter? Let’s take a look at a somewhat simpler example.
Guiding Dutch Tax Spending
Imagine you’re the government of the Netherlands, and you want to figure out how to spend your tax money. Different groups will have different ideas for how that money is best spent. “Build schools and daycares!” says one group, concerned with the welfare of Dutch children. “Our society is getting older. We need more infrastructure for the elderly!”, says another. What should you do?
Well, you might want to turn your data. One axis (albeit a very simplistic one) you could explore is simply the number of people in different age groups. How many Dutch citizens are there who are children? How many are retired? How many are of working age? This might give you a first idea for where you might need to spend more money.
Thankfully, the statistics agency of the European Commission, Eurostat
collects a lot of data about the citizens of countries in the European Union (and beyond), and
makes it freely available. In the file eurostat_pop_age.csv of the /data/ directory in
the repository belonging with this tutorial, you can find the data set describing the
population of the Netherlands as a function of age as of January 1, 2018.
The data comes as a simple table: for every year of age, there’s the number of Dutch citizens being that age. There are two special categories: one for the age bracket below 1 year, so all children who have not had their first birthday yet, and one age bracket for all citizens who are older than 100 years.
The groups who are making proposals to your government for how to spend tax money also have access to the data. And so the group proposing increasing spending on schools provides you with this visualization:
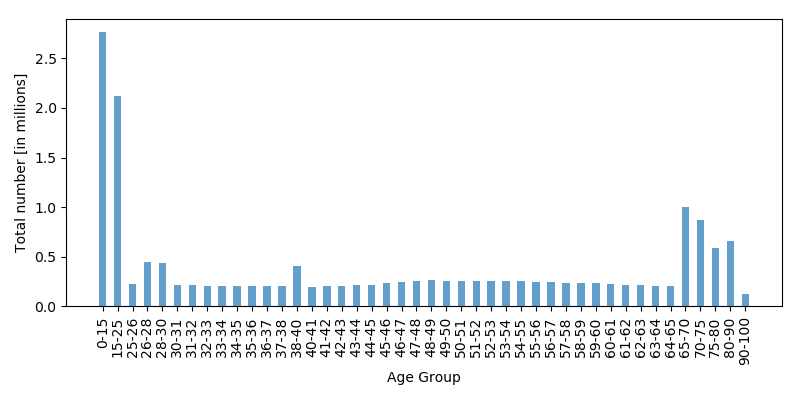
“Well”, they say, “the case is clear! Look at all those children being born the Netherlands! Who will care for them? There are so many more children the grown-ups! We definitely need more schools and daycare centres!”
Do you agree?
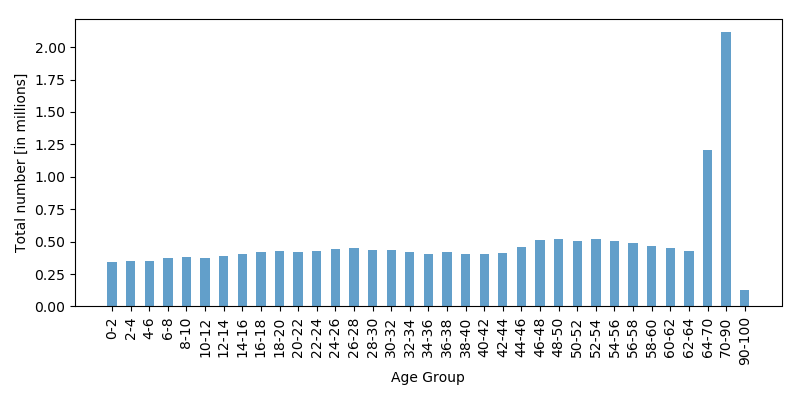
The proponents of providing more services to the elderly definitely disagree. “They’ve plotted the data all wrong!”, they proclaim. “We have the same data, but reality looks very different. Take a look at our version and tell us we shouldn’t spend more on infrastructure for the elderly!”
And so they provide you with the following figure:
So what should you do? Which one is right? And how can two visualizations based on the same data look so wildly different? The key issue here is the x-axis. Bar charts like those above with equally spaced distances between them, all plotted using the same y-axis, imply that the quantities being plotted are directly comparable. Because of their equal widths, your brain generally assumes that you can compare the heights of the bars, and that these heights are intrinsically meaningful in the sense that a higher bar means more of whatever quantity is plotted on the y-axis.
This is not the case for the two visualizations above. In the first, the creator has grouped together citizens in the age groups 0-15 and 15-25 into single bars, but age groups above are much smaller. As a result, the age ranges of young people are much larger than the age rangers of adult citizens, and the heights of the bars on the y-axis are no longer directly comparable.
The proponents of putting more tax money into services for the elderly have played the same trick, but in reverse: they have grouped together citizens of retirement age into age groups spanning 64-70, 70-90 and 90-100, while citizens below are grouped into much smaller age bins. As a result, it looks like there are many more citizens who are retired than those who are not!
Both visualizations are based on the same data, and they both provide the same kind of information. Does that mean they are both correct? Or both wrong? I would argue that while they are not wrong, they are mis-leading, potentially intentionally so for personal or political gain.
Here’s the same data plotted using more conventional equally sized bins of 5 years:
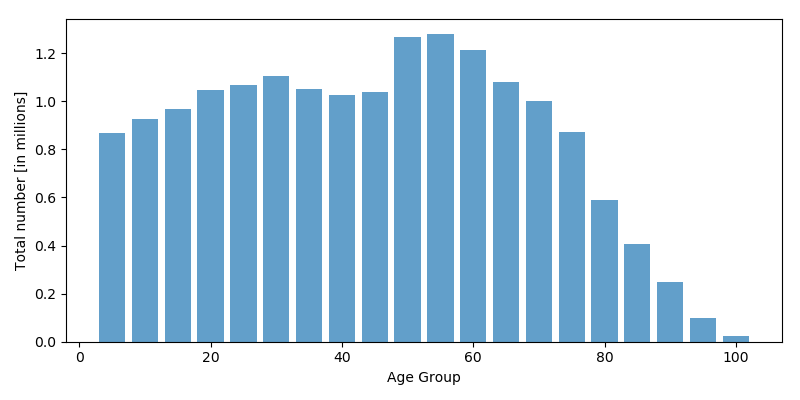
I would argue that this is the visualization that is most faithful to the underlying data and the least misleading, because our initial assumption–that the height of the bars is directly comparable to that of the other bars–is true. It’s not that it is impossible to understand the other two visualizations, but it requires considerably more mental effort to correct for the unequal bin size, which may in reality hide the message the visualization can tell.
Generating a mis-leading visualization does not imply ill or malicious intent. In the Figure about US income that started this discussion here, the Wall Street Journal simply showed the figures in the income brackets that the US Internal Revenue Service provides to them (presumably for unrelated, potentially entirely valid reasons). It is perhaps merely chance that the misleading representation coincides so well with the political statement the newspaper aimed to make, but it is mis-leading nevertheless in exactly the same way the (invented) scenario of Dutch tax spending above.
Be aware of (your own) biases
We all have biases and pre-conceptions that influence our decisions when designing experiments and surveys, gathering data, performing data analysis and creating data visualizations.
Because data sets and visualizations are ultimately generated by people, they are social constructs and not objective (see also Broussard, Artificial Unintelligence).
Be aware of the assumptions and biases that may influence visualizations you read and create.
Brendan Nyhan has a great discussion of the Wall Street Journal example on his blog, where he shows figures from Kevin Schultz, a political scientist at Stanford. These figures explore different binnings for the IRS data above, and demonstrate that you can generate a plot for every political message you’d like to put forward, whether it is that we should tax the poor, or the very rich.
Consistent Messages
In general, when the conclusions to be drawn from a visualization depend very strongly on the choice of visualization and visualization properties like unequal binning in bar charts or the scaling of axes, it is likely that the message that the visualization is designed to convey is not strongly supported by the data.
Be wary of such visualizations.
When reading data visualizations, no matter the publication, it is worth being critical of the design and the goal of the visualization: what choices did the designer make that I can see? Are there odd design choices that might be a red flag? What intention does the designer have with this visualization? Do I trust them to make ethical choices in their design? Do I trust that this visusalization is a faithful and largely unbiased representation of the underlying data? Is the data public and can I explore it myself?
Ask yourself similar questions when designing your own visualizations: what intention do I have with creating this visualization? Is my visualization faithful to the information that is contained in the data, or does it overrepresent or misrepresent (even accidentally) this information? If I chose different parameters for my visualization, would my message change drastically?
- Also include link to [Calling Bullshit lectures][https://callingbullshit.org/videos.html]
Key Points
First key point. Brief Answer to questions. (FIXME)