The Cognition of Visual Information
Overview
Teaching: 10 min
Exercises: 10 minQuestions
How does our brain process visual information?
What attributes are pre-attentive, which ones aren’t?
How can this knowledge help us design more effective visualizations?
Objectives
Understand the difference between pre-attentive and serial processing of visual information
Understand which attributes are pre-attentive, and which ones aren’t
Apply this knowledge to improve a visualization.
Much of what follows is a summary of the excellent review paper “Attention and Visual Memory in Visualization and Computer Graphics” by Healey and Enns (website or PDF). There is lots more to say about visual perception that I can do here. For more detailed information on the topic, and some background on the underlying theories of perception, take a look at the website and PDF and the references mentioned in both. Another excellent resource is the book “Information Visualization: Perception for Design” by Colin Ware. Human perception is a fascinating topic!
How does the human brain perceive visual information? How do we go from ink on a paper, or pixels on a screen to an understanding in our minds? It might be easy to assume that whatever light falls into our eyes is perceived and stored by our brains. This is not true, however! Our eyes and brains are not cameras, passively generating more or less faithful reconstructions of reality! Healy and Enns liken visual perception to a “dynamic and ongoing construction project, where the products being built are short-lived models of the external world that are specifically designed for the current visually guided tasks of the viewer.”
There does not appear to be general-purpose vision! Instead, what we perceive when we are confronted with a scene depends on our goals, our expectations, our state of mind, and where our attention is in any given moment. There are tasks that we can perform in less than the blink of an eye (quite literally!), and there are things that we are equally just entirely blind to without expending a significant amoutn of mental effort. Designing a visualization is not simply a matter of choosing shapes and colours: it becomes the task of working with your viewer’s minds to help them make sense of the most important information you are trying to convey. The goal is to work with our brains’ strengths to guide the viewer’s attention, and make sure the brain’s weaknesses do not impede understanding.
This leads to a number of important questions to think about when designing a visualization:
Key Visualization Questions
- How should I represent my data?
- How can I highlight important values in my visualization?
- How can I ensure that viewers perceive differences in data accurately?
- What visual properties draw the eye, and our focus of attention to a particular object?
- How do we display information without producing visual confusion?
Thankfully, our brains are pretty amazing, and there are a range of strengths of visual cognition, the science of how we perceive things with our eyes, to help viewers understand our visualization.
Pre-Attentive Processing
There are a number of visual tasks that the brain can perform incredibly fast. Initially, researchers believed that these tasks happen as soon as the eye takes in an image or a scene, before our attention is directed anywhere. More recent work suggests, however, that attention plays a crucial role in all visual perception, and that we can miss important elements in a scene when our attention is directed away from them (more on that below).
In this sense, the term “pre-attentive processing” is a bit of a misnomer, but has stuck around for its descriptiveness. More generally, researchers consider a task pre-attentive if a viewer can perform the task in large, multi-component displays of information in less than 200-250 milliseconds (this is really short!).
As an example, consider the two figures below, taking from Healy & Enns, 2012 (Figure 1). Which of the two contains a red dot?
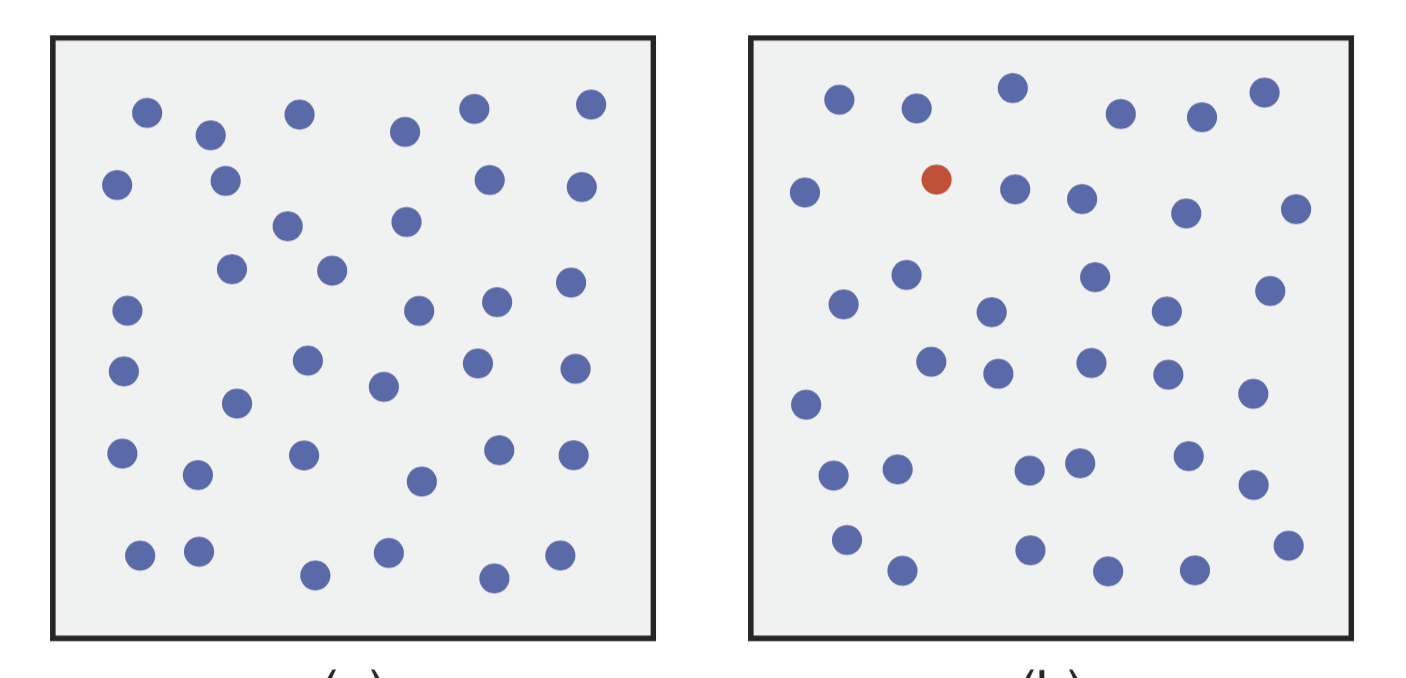
For most of you, the answer was probably fairly obvious. The red dot (called the “target”) “pops out” at us from the sea of blue dots (also called “distractor”).. We don’t need to think about it, and we don’t need to search each dot until we find the right one. The red dot is just there. This is pre-attentive processing at work, and colour is a strong pre-attentive feature.
We can repeat the same experiment with shapes (from the same figure). Which of the following two panels contains a red dot?
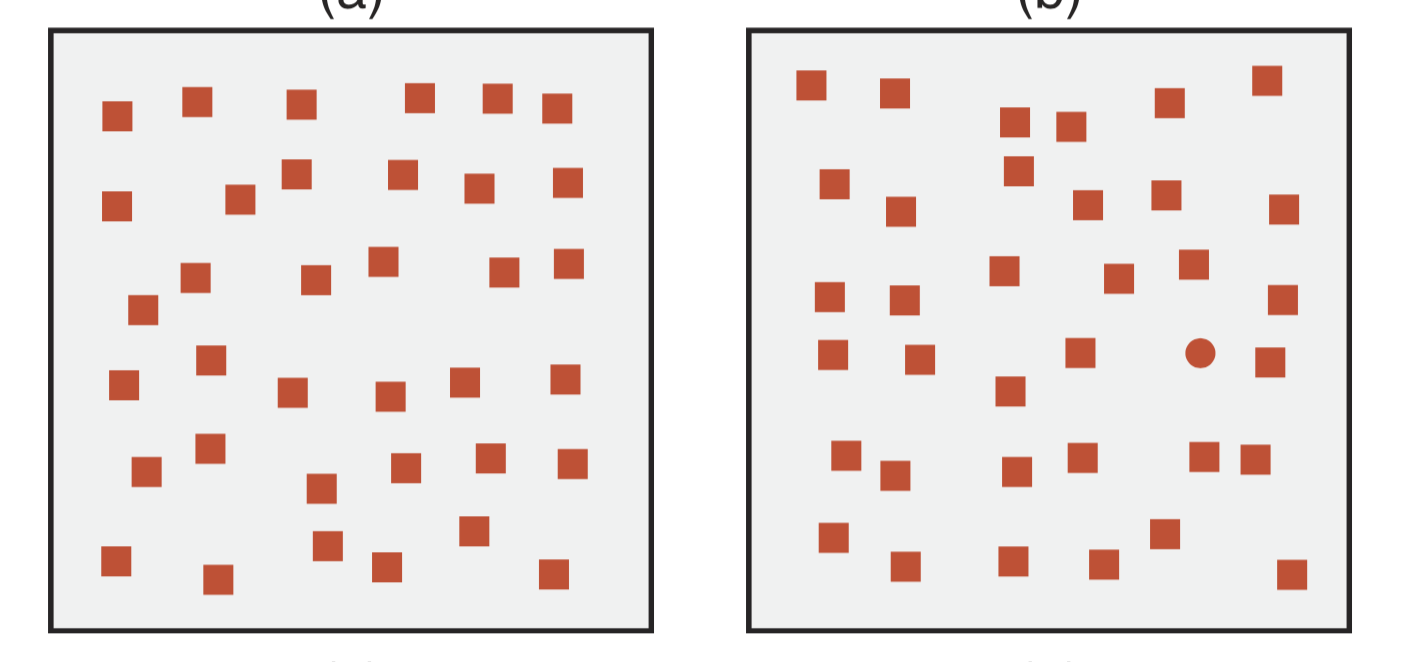
Again, many people can perform that task reasonably quickly, without having to search through every shape until they find the circle. The circle is just there, the eyes drawn instinctively. Shape, or more accurately, curvature, is a preattentive task.
There a whole number of pre-attentive features (see also Figure 2 of Healy & Enns, 2012), among them size, orientation, length, density, hue, luminance, intersections, 3D depth, direction of motion, and lighting direction. Encoding information using pre-attentive features helps guide our eyes to the most important pieces of information in a visualization. For example, if there’s a particular data point in your scatter plot that is important, give it a different colour to make it pop out!
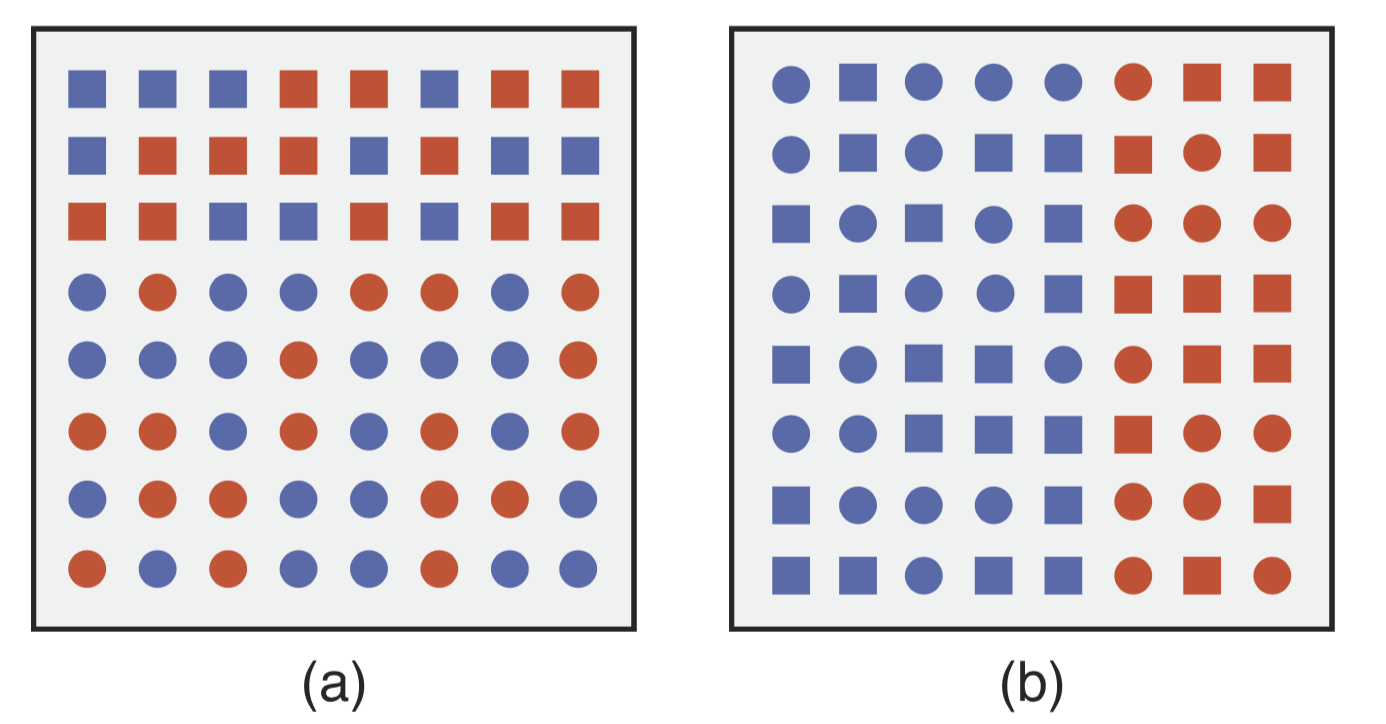
What happens if you combine pre-attentive features? What happens when you’re trying to find a red dot in a figure filled with red squares and blue circles? Let’s give it a try. In the figure below, which panel has a red dot?
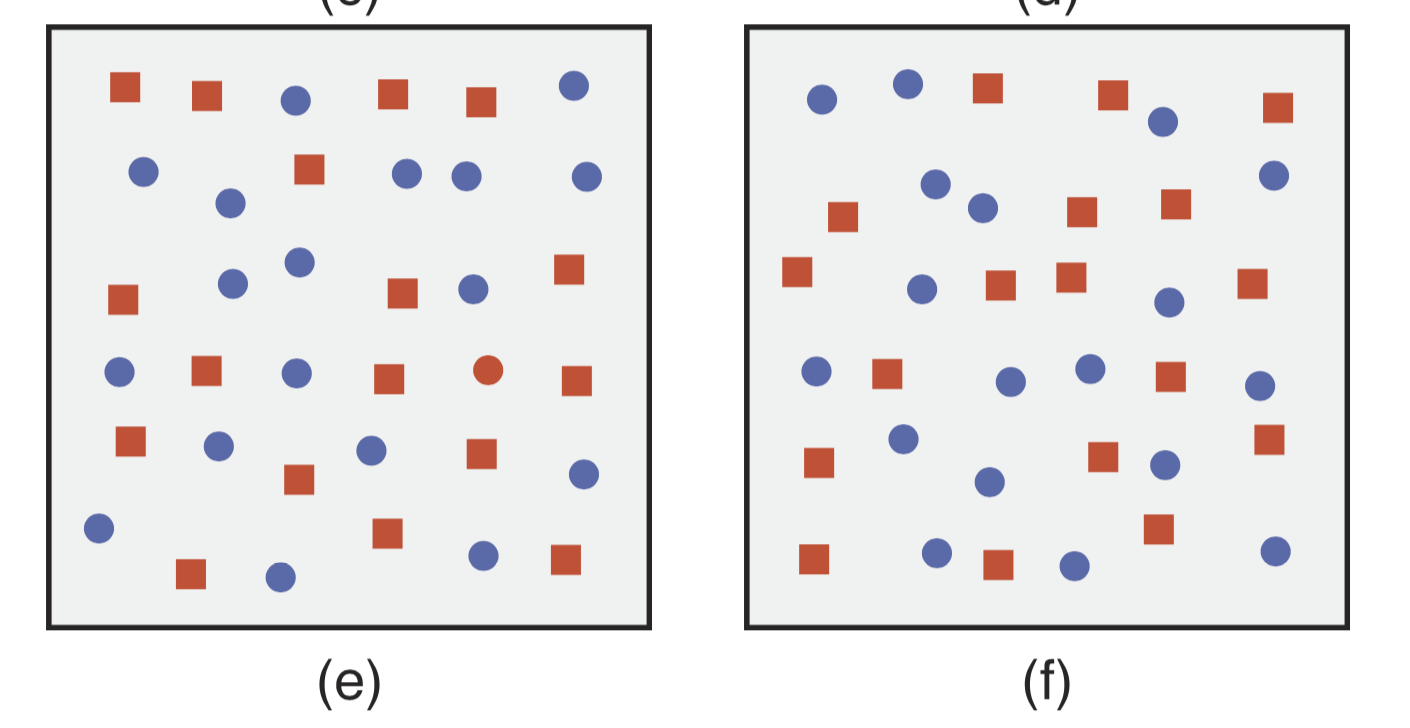
If you’re anything like me, this was much harder and took much longer. The reason is that both the shape (circle) and the colour are present in the distractors (though not together). Trying to find two separate attributes in an ensemble of distractors that contain the same attributes (even though not together) is no longer a pre-attentive task. Instead, we have to search through the elements one by one until we find the one that matches our target. This requires a lot more time and mental energy.
One of the cognitive theories aiming to explain pre-attentive processing suggests that similarity plays a crucial role in finding patterns. The more similar the target and the distractors are, the harder it is to pick out the target. But this theory suggests that the similarity between distractors also plays a role in pre-attentive processing: the more dissimilar distractors are to each other, the harder it becomes to pick out the target.
Exercise: Try it yourself!
Healy has a great little online app that lets you try this out yourself: you can find it on his website.
The apps hows you images like the ones you’ve seen above, with circles or squares, where your task is to figure out whether there’s a red dot in each of them. The image will be shown to you for a very short time, and afterwards it will tell you whether a red dot was present or absent, which allows you to figure out whether you found it or not.
The app allows you to choose whether to display colours, shapes or the conjunction of both. it also allows you to choose the time in milliseconds that a display will be shown to you, the number of distractor elements, and the number of times you’ll be shown an image.
How does your performance for pre-attentive tasks depend on the time the image is shown to you, the number if distractor elements, and the type of task (colour, shape, both)?
Start out with colour, and systematically vary the exposure time from 500ms to 100ms. Do ten trials per exposure time. How does your accuracy of prediction change?
Now pick the lowest exposure time that gives you good accuracy, and vary the number of elements. Does your performance change significantly>
Repeat the exposure time experiment with shape and the combined shape and colour versions. Is your minimum exposure time signfiicantly different for these cases?
We have seen how some attributes make cognition very fast, and how combinations of attributes loose this cognitive advantage. How do we use this knowledge in visualization?
Pre-Attentive Features
When encoding the most important information in your visualization, choose features that are pre-attentive, and avoid combinations of attributes that require a serial search to find and undersstand.
Ensemble Coding
One interesting component of pre-attentive processing is ensemble encoding: it turns out our brain can record summary statistics about an ensemble of shapes incredibly quickly, even though it won’t remember the individual elements: for example, consider the figure below with circles in blue and green of multiple sizes. In each of the two panels, are the blue or the green circles larger on average?
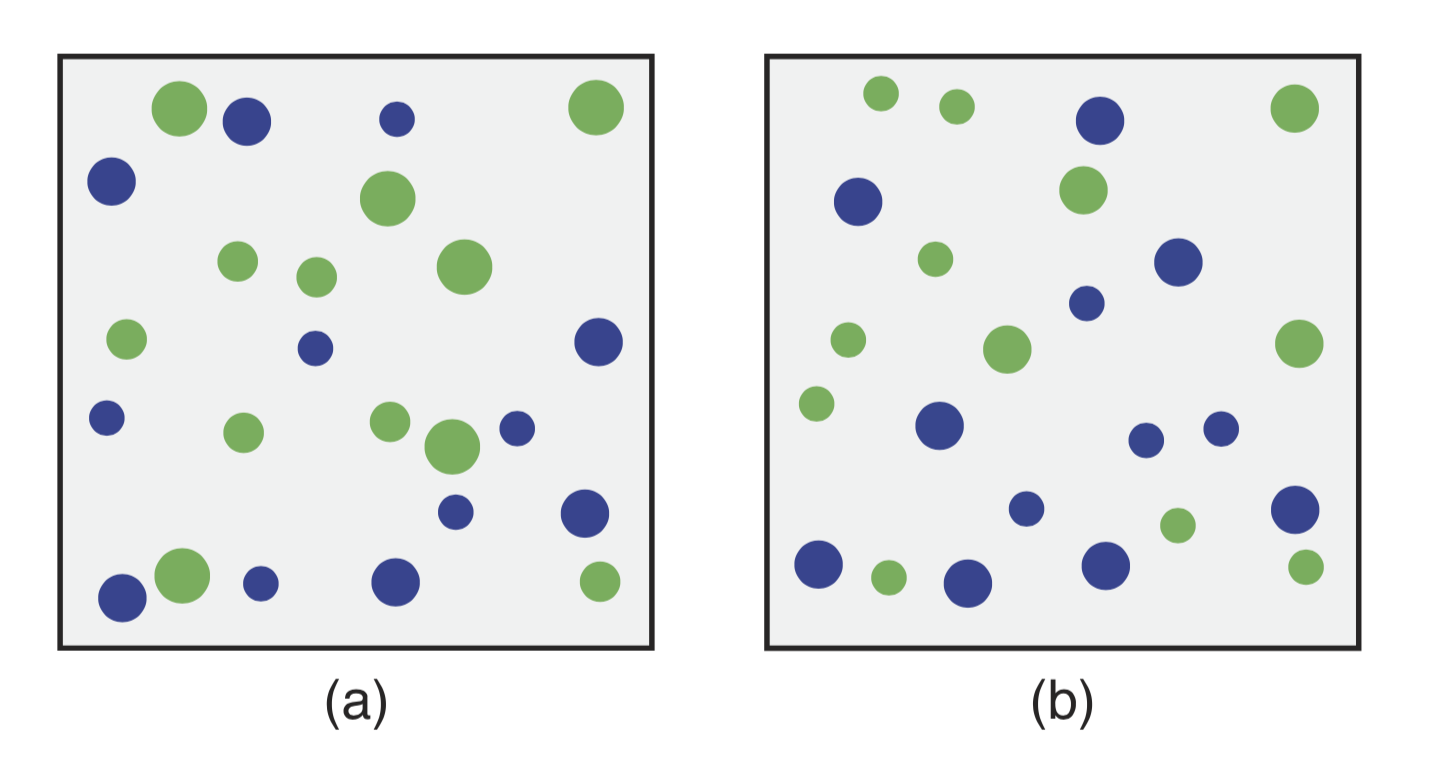
In experiements, viewers can generaelly tell very quickly whether the green or the blue circles are, on average, larger, even if they see the figure for just a short moment. However, they won’t be able to answer whether any particular circle has a given size, or is small or larger than its neighbouring circle. Somehow, our brain stores information about the ensemble, without also storing the information about each individual member of the ensemble, which seems pretty cool!
Feature Hierarchy
All right, let’s make this a little bit more complex. So far, we have mostly looked at individual features, which turned out to be quick to process, ensembles, which also turned out to be quick (unless we care about individual elements), and conjunction searches, which are difficult and slow.
But are all types of features equally fast and easy to distinguish? As it turns out, there exists a hierarchy. Consider the example below (from Healy & Enns, 2012, Figure 10). Where is the boundary between elements?
 ]
]
In boundary detection, the visual system favours colour over shape. The background variations in colour slow down our perception of the edge between the group of circles and the group of squares. This kind of task will be slower, but still pre-attentive. The interference of colour with our perception of shape is asymmetric: in the right panel, the background variations in shape do not slow down our perception of the boundary between blue and red elements nearly as much. What does this mean for visualizating data?
Feature Hierarchies
Choose the most salient features to encode the most important data attributes.
For example, researchers have also found preferences for luminance over hue (more on the difference between those two in the colour section), and for hue over texture.
A related concept is visual interference. If I display a number of visual features together, will they perform as expected? For example, I might make a scatter plot where I encode one attribute of my data in the colour, and another, different attribute of my data in shape. Are those patterns equally discernable to the viewer? As it turns out, features can intefere with one another, and once again, a hierarchy exists: perceptionally strong features like luminance and hue can mask weaker features like curvature. So when a viewer looks at a figure, they migiht recognize the different colours, but might not pay attention to the changes of shape if the latter denote a different axis of information.
Avoid Visual Interference
If encoding multiple axes of information, choose the most salient visual feature for the most important pieces of information to make sure less important attributes won’t “hide” data patterns that the viewer is interested in.
Memory
Guiding the viewer’s eye to the most important pieces of information and ensuring these will be recognized quickly is only half of the equation. An equally important question is: What will the viewer remember once they look away? What do we forget? What do we not even notice in the first place?
As we have mentioned above, the brain is extremely selective about what it sees and remembers, which turns out to be a small fraction of the information that the light falling into our eyes conveys. There are three perceptional concepts that are important to keep in mind for data visualization in this context:
- Post-attentive amnesia: Experiments found that having seen an image before for a short while offers no help in rapidly identifying the presence of an object when that same image is shown again. This is called post-attentive amnesia: we mostly forget what we just saw if we don’t already know what we’re supposed to look out for. However, if a serial search is interrupted, picking that serial search up again is much faster than starting anew.
- Change blindness: Have you ever looked at one of those puzzles where you compare two images and find the differences? In general, they tend to be difficult and time consuming. This is because of a cognitive effect called change blindness. We cannot remember details of an image across separate scenes except in areas where viewers have focused their attention. A blink or a blank screen is enough to blind us to significant changes that occur in the scene during the interruption. This has important implications for multi-panel figures. Because viewers are generally blind to changes between two images, even when they are side by side, we must take extra care to direct viewers’ attention to the differences between two panels if these turn out to be important to understanding the data.
- Inattentional blindness: This is one of the most fascinating cognitive effects. While directing the viewer’s attention to a specific task can help with change blindness, it can at the same time induce inattentional blindness. This happens when focusing on a specific part of an image or a scene renders us blind to other elements of that image or scene, even when these elemenets are in the middle of our fields of view. We are so focused on a specific task or area of the figure that we never even perceive the other elements. There is a fascinating study where researchers showed participants a group of people passing a basketball. If you’ve never tried it, I encourage you to go to this youtube video and count the number of times that the people in the white shirt pass the basketball, before reading on.
The participants were asked to count the number of times that the people in the video wearing white shirts passed the ball. Unbeknownst to the participants, a person in a gorilla costume walks through the video. When asked whether they saw anything unusual in the video, an astonishingly large number of them never saw the gorilla walking through the video, because they were entirely preoccupied with tracking the basketball and figuring out whether it was currently held by a person in a white or a black shirt.
This has led to the hypothesis above that there is no perception without attention. Guiding attention is important to ensuring that the viewer perceives the information on display accurately, and takes away the key points. Elements to which the viewer is never guided might simply never be registered. So as a general guideline, don’t encode important information in these elements, because they might not be perceived or remembered!
Key Points
Visual cognition depends crucially on attention, state of mind, goals, and expectations.
There are visual features that our visual system can comprehend in less than 200 ms
When conjoining these features, finding a target becomes a serial search and therefore slow and difficult.
Our brain can comprehend summaries of ensembles quickly, even without recalling the attributes of individual elements
There are feature hierarchies that make certain attributes easier/faster to comprehend than others
Humans are prone to blindness to change between images, as well as blind to elements of an image or scene that our attention isn’t focused on.